CEUS for characterisation of focal lesions
June 19, 2019
Student Image Challenge 07
June 25, 2019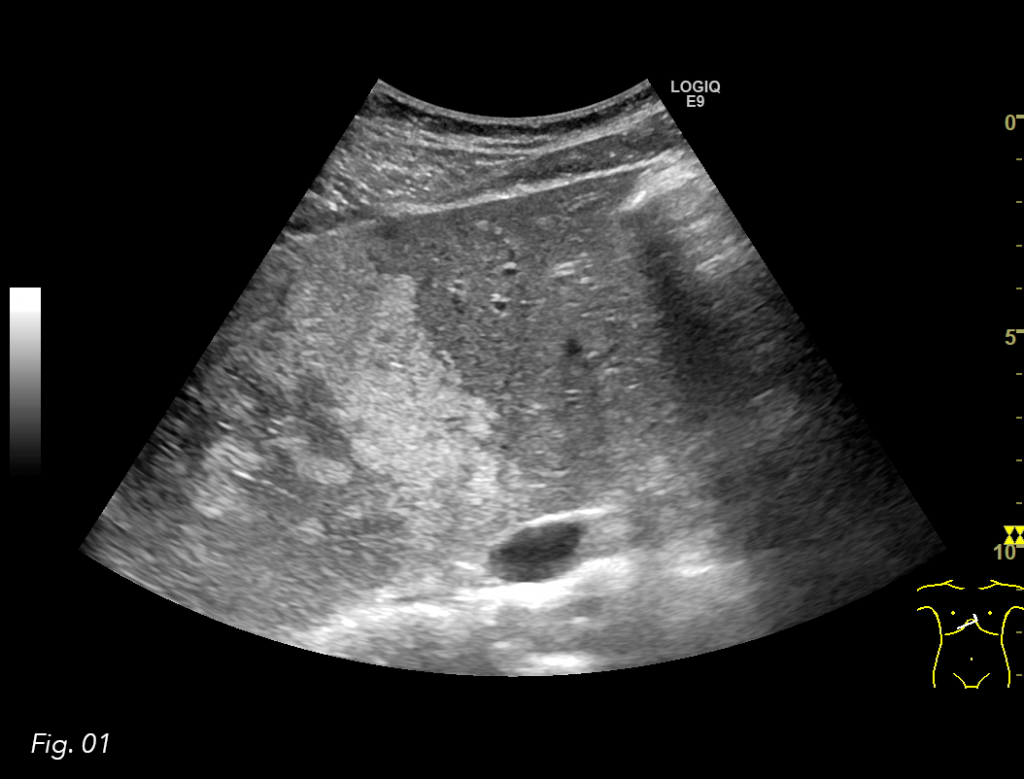
Unexpected finding of large, multifocal focal fatty infiltration of the liver in a patient with hypothyroidism and coeliac disease
AUTHORS:
Stinne Byrholdt Søgaard, Caroline Ewertsen.
Rigshospitalet, Copenhagen University Hospital
Stinne Byrholdt Søgaard, Caroline Ewertsen.
Rigshospitalet, Copenhagen University Hospital
![Unexpected finding of large, multifocal focal fatty infiltration of the liver in a patient with hypothyroidism and coeliac disease </br> [Jun 2019]](http://s834315022.websitehome.co.uk/wp-content/uploads/2020/11/Jun2019-Fig.1.png)
![Unexpected finding of large, multifocal focal fatty infiltration of the liver in a patient with hypothyroidism and coeliac disease </br> [Jun 2019]](http://s834315022.websitehome.co.uk/wp-content/uploads/2020/11/Jun2019-Fig.2.png)
![Unexpected finding of large, multifocal focal fatty infiltration of the liver in a patient with hypothyroidism and coeliac disease </br> [Jun 2019]](http://s834315022.websitehome.co.uk/wp-content/uploads/2020/11/June2019-Fig3arrow.png)
![Unexpected finding of large, multifocal focal fatty infiltration of the liver in a patient with hypothyroidism and coeliac disease </br> [Jun 2019]](http://s834315022.websitehome.co.uk/wp-content/uploads/2020/11/June2019-Fig.4.png)
![Unexpected finding of large, multifocal focal fatty infiltration of the liver in a patient with hypothyroidism and coeliac disease </br> [Jun 2019]](http://s834315022.websitehome.co.uk/wp-content/uploads/2020/11/June2019-Fig5arrow.png)
![Unexpected finding of large, multifocal focal fatty infiltration of the liver in a patient with hypothyroidism and coeliac disease </br> [Jun 2019]](http://s834315022.websitehome.co.uk/wp-content/uploads/2020/11/June2019-Fig6arrow.png)
1Clinical History
A 27-year-old male with a history of hypothyroidism and coeliac disease was referred to our clinic with a clinical suspicion of gallbladder stones. The patient had had 3 episodes of diarrhoea and vomiting within one month and abdominal pain in the right upper quadrant without a fever. No other family members had been ill. Liver enzymes, white cell count and CRP were within the normal range. His regular medication included Eltroxin 150 mg, 5 times weekly and 200 mg twice weekly and he adhered to a gluten free diet.
2Imaging Findings
An ultrasound examination of the abdomen was performed using a GE Logiq E9 system with a curved array transducer and a frequency of 1-6 MHz. The patient was examined in the supine position. The examination revealed a large hyperechoic area in the liver hilum surrounding the portal vessels, involving segments IV, V and VIII. The lesion had an irregular borders, but the remaining liver parenchyma appeared normal (Fig. 1, 2).
The portal vein and hepatic artery had normal Doppler signals and there was no invasion of the vessels (Fig. 3). Normally, a contrast-enhanced ultrasound (CEUS) would have been performed, but due to the large size, the irregular borders and the patient’s comorbidities, an MRI of the abdomen with liver specific contrast agent (Primovist) was performed to characterize it further. In- and out-of-phase images showed that the lesion was focal fatty infiltration, but with an unusual large size (Fig. 4, 5, 6). The behavior of the lesion after contrast administration was similar to the surrounding liver parenchyma.
The portal vein and hepatic artery had normal Doppler signals and there was no invasion of the vessels (Fig. 3). Normally, a contrast-enhanced ultrasound (CEUS) would have been performed, but due to the large size, the irregular borders and the patient’s comorbidities, an MRI of the abdomen with liver specific contrast agent (Primovist) was performed to characterize it further. In- and out-of-phase images showed that the lesion was focal fatty infiltration, but with an unusual large size (Fig. 4, 5, 6). The behavior of the lesion after contrast administration was similar to the surrounding liver parenchyma.
3Discussion
Steatosis of the liver may be focal, geographic, diffuse, subcapsular, multifocal or perivascular (1). Steatosis, focal or general, is seen as hyperechoic areas, when the liver is examined by ultrasound, and the liver/kidney gradient is increased. It is typically located in segment IV or V, around the liver hilum and on either side of the gallbladder (2,3).
Hepatic steatosis is often discovered coincidently by ultrasound or CT performed for other reasons and may be further investigated by MRI. Usually, it is easy to differentiate focal fatty infiltration or sparring from other diagnoses because of its size and location and further investigation with CEUS or MR is generally not performed. Due to the patient’s comorbidities and his young age, it was important to determine the origin of the lesion. On unenhanced CT, steatosis presents as hypoattenuation with a Hounsfield Unit (HU) of liver parenchyma less than 40, or 10 HU less than that of the spleen. When diagnosing steatosis on MRI, a signal drop is seen on the T1 out-of-phase images (1,2). On B-mode ultrasound images, focal fatty infiltration can have similar appearances to haemangiomas, hepatocellular adenomas (HCA), hepatocellular carcinomas (HCC) and cholangiocarcinomas. On CEUS, focal fatty infiltration enhances in a similar pattern to the adjacent normal fatty liver with iso-enhancement in the portal venous and late phases. Haemangiomas however, demonstrate either flash filling or have a slow, discontinuous, nodular enhancement in the arterial phase, with filling in to near completion in the portal venous and venous phase. Focal Nodular Hyperplasia (FNH) is usually isoechoic in B-mode, hyperenhancing on CEUS in the arterial phase and has sustained enhancement in the portal venous phase and possible presence of an unenhanced central scar. HCAs are rare and may appear heterogeneous in B-mode. On CEUS, they are hyperenhancing in the arterial phase (but less than FNH) with centripetal filling in. HCA is seen more frequently in women taking estrogen-containing oral contraceptive medication, but also in men abusing anabolic steroids (3).
Hepatic steatosis is known to arise primarily from alcohol abuse or in patients with metabolic liver disease (non-alcoholic fatty liver disease (NAFLD)) (2). Individuals with coeliac disease are at increased risk of NAFLD with a hazard ratio of 13 the first year and 2.5 in general (4). Although it is not known whether there is an increased risk of focal fatty liver infiltration when suffering from hypothyroidism there is a significant association between primary hypothyroidism and the risk of developing NAFLD (5).
4Conclusion
Ultrasound is a fast and safe imaging modality for imaging of focal or general hepatic steatosis, however MRI may be required when the diagnosis remains unclear as in this case with a rather generalized appearance of focal fatty infiltration, which is uncommon to see.
No direct association between focal fatty infiltration and hypothyroidism and coeliac disease was found, but it is known that metabolic diseases are closely related and may pre-dispose to fatty change.
5Figure Legends
Fig. 1: US image of the liver. Transverse plane of the segments II and IV, where the difference between normal liver and the parenchyma with focal fatty infiltration is seen.
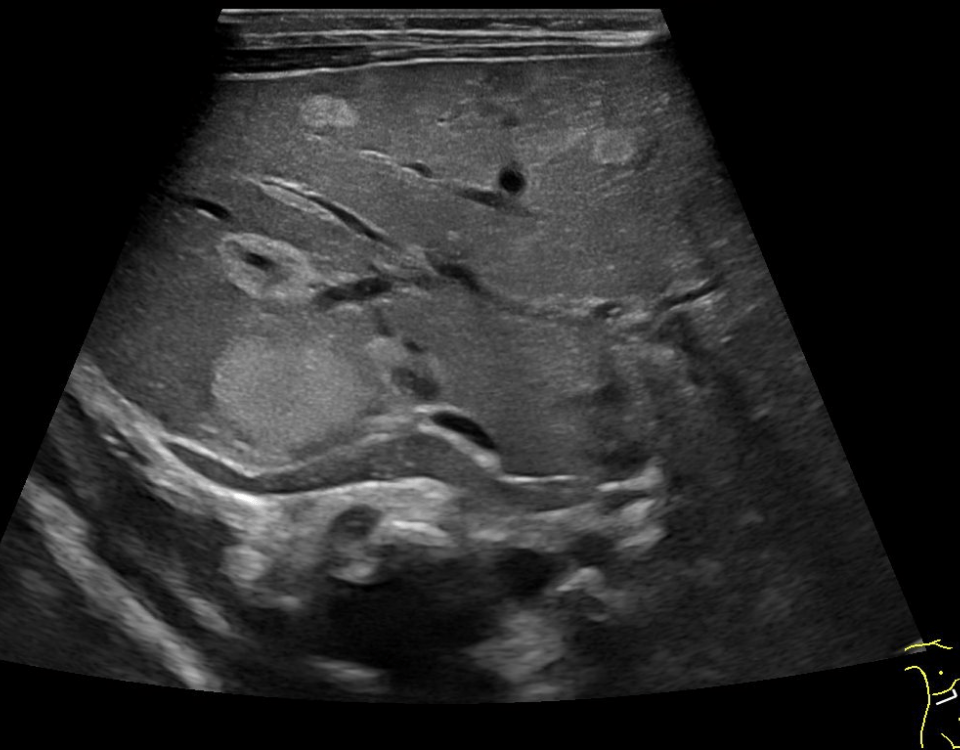
Fig. 2: US image of the liver. Focal fatty infiltration in segment V next to the gallbladder.
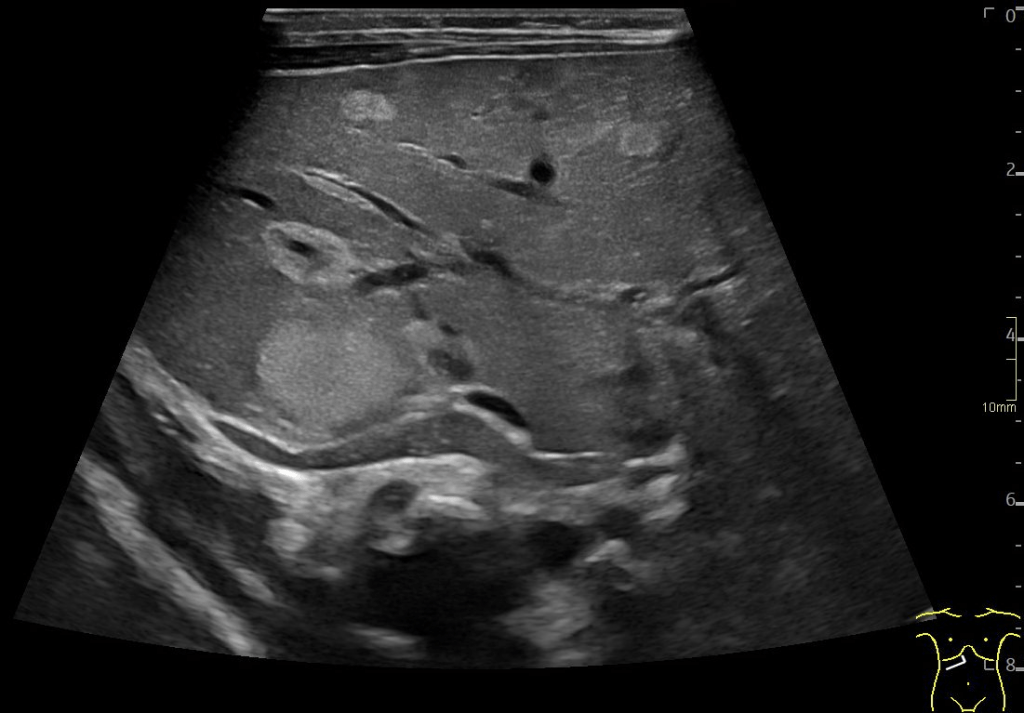
Fig. 3: US image of the liver. Semi sagittal plane through the right liver lobe with color Doppler in the right portal vein showing focal fatty infiltration in segment V and VIII – note no distortion of vessels (arrow).
Fig. 4: Axial T2 weighted image. The liver parenchyma appears homogeneous and isointense.
Fig. 5: Axial T1 in-phase image. The area with fatty infiltration is isointense to the surrounding liver parenchyma (arrow).
Fig. 6: Axial T1 out-of-phase image. Signal drop in the fatty infiltration (arrow).
Fig. 2: US image of the liver. Focal fatty infiltration in segment V next to the gallbladder.
Fig. 3: US image of the liver. Semi sagittal plane through the right liver lobe with color Doppler in the right portal vein showing focal fatty infiltration in segment V and VIII – note no distortion of vessels (arrow).
Fig. 4: Axial T2 weighted image. The liver parenchyma appears homogeneous and isointense.
Fig. 5: Axial T1 in-phase image. The area with fatty infiltration is isointense to the surrounding liver parenchyma (arrow).
Fig. 6: Axial T1 out-of-phase image. Signal drop in the fatty infiltration (arrow).
6References
1. Patrick-Olivier Décarie, Luigi Lepanto, Jean-Sébastien Billiard et. al, Fatty Liver deposition and sparing: a pictorial review, 2011; 2: 533–538
2. V. Vilgrain, M. Ronot, M. Abdel-Rehim, et. al, Hepatic steatosis: A major trap in liver imaging, doi.org/10.1016/j.diii.2013.03.010
3. EFSUMB course book 2nd edition, Dietrich et al., 2018
4. Norelle R. Reilly, Benjamin Lebwohl, Rolf Hultcratz et. al, Increased Risk of Nonalcoholic Fatty Liver Disease After Diagnosis of Celiac Disease, J Hepatol. 2015; 62:1405-1411.
5.Lugari S, Mantovani A, Nascimbeni F and Lonardo A, Hypothyroidism and nonalcoholic fatty liver disease - a chance association?, doi: 10.1515/hmbci-2018-0047