Ultimate Ultrasound Solution for Breast
November 8, 2018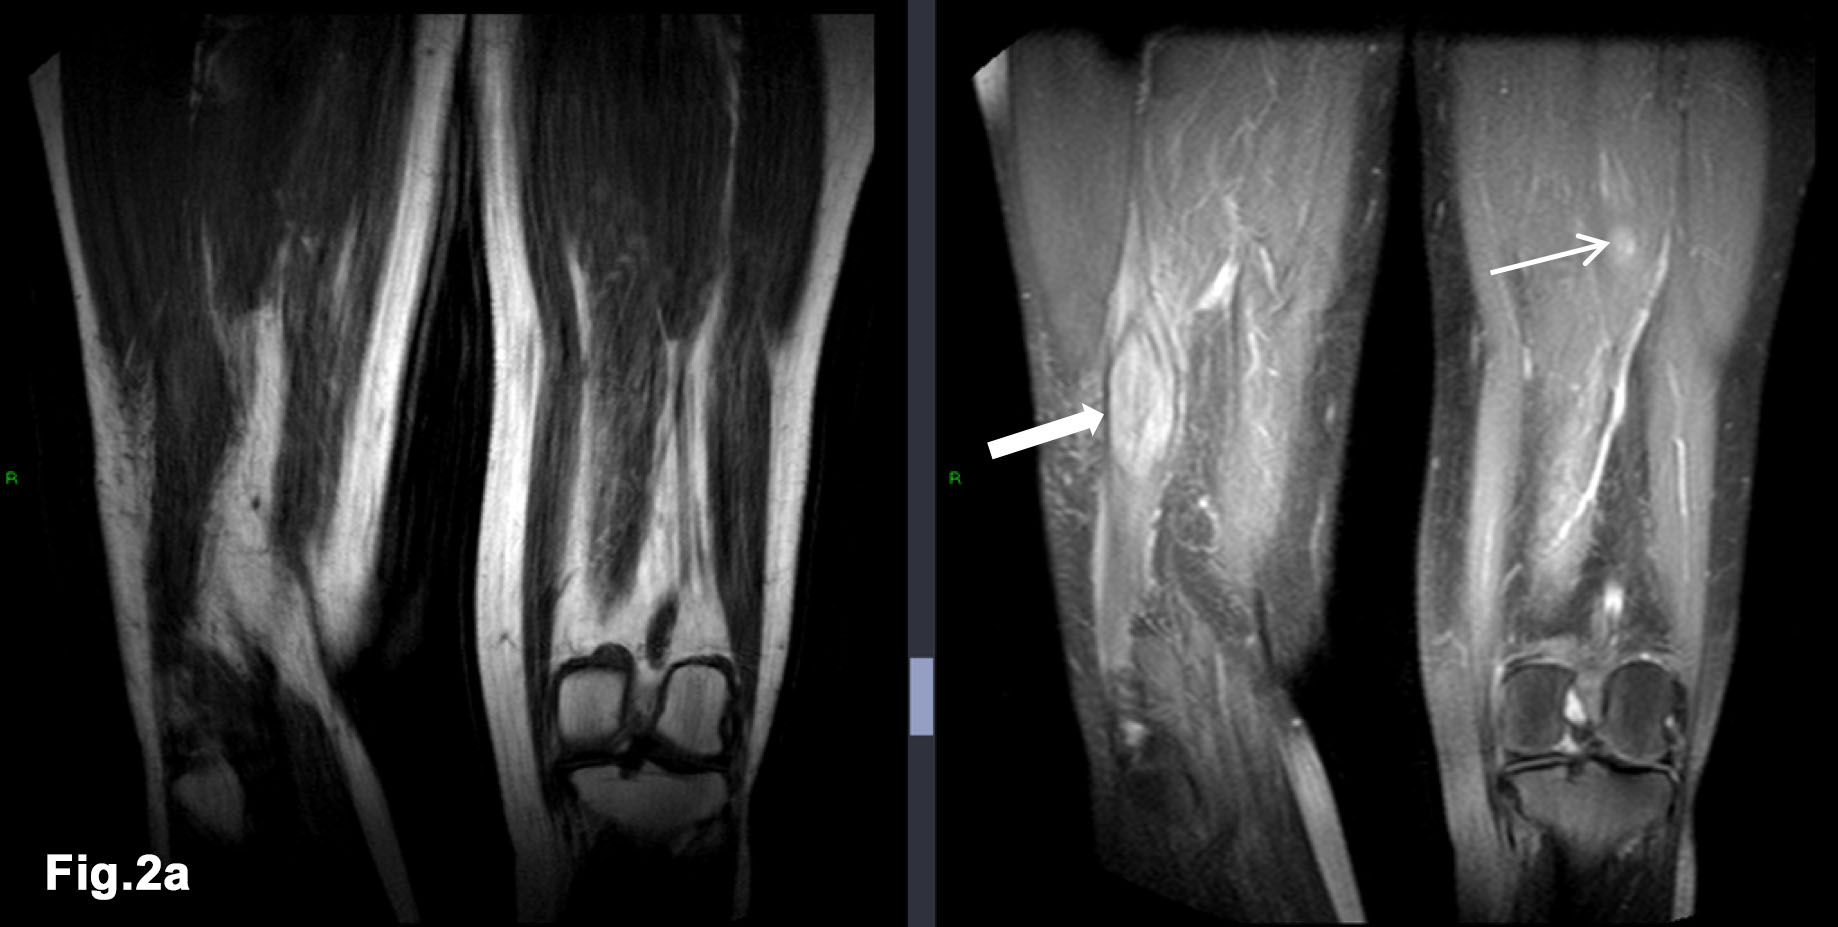
Don’t forget about the intramuscular metastasis! [Dec 2018]
December 18, 2018
A rare case of a co-located pigmented naevus and dermal cyst: The utility of very high frequency Ultrasound and Videodermoscopy for differentiation
Dr. ARTUR BEZUGLY Email: DrArturBezugly@gmail.com
![A rare case of a co-located pigmented naevus and dermal cyst: The utility of very high frequency Ultrasound and Videodermoscopy for differentiation </br> [Nov 2018]](http://s834315022.websitehome.co.uk/wp-content/uploads/2020/11/COTM_nov2018-Figure1.jpg)
![A rare case of a co-located pigmented naevus and dermal cyst: The utility of very high frequency Ultrasound and Videodermoscopy for differentiation </br> [Nov 2018]](http://s834315022.websitehome.co.uk/wp-content/uploads/2020/11/COTM_nov2018-Figure2.jpg)
![A rare case of a co-located pigmented naevus and dermal cyst: The utility of very high frequency Ultrasound and Videodermoscopy for differentiation </br> [Nov 2018]](http://s834315022.websitehome.co.uk/wp-content/uploads/2020/11/COTM_nov2018-Figure3.jpg)
![A rare case of a co-located pigmented naevus and dermal cyst: The utility of very high frequency Ultrasound and Videodermoscopy for differentiation </br> [Nov 2018]](http://s834315022.websitehome.co.uk/wp-content/uploads/2020/11/COTM_nov2018-Figure4.jpg)
![A rare case of a co-located pigmented naevus and dermal cyst: The utility of very high frequency Ultrasound and Videodermoscopy for differentiation </br> [Nov 2018]](http://s834315022.websitehome.co.uk/wp-content/uploads/2020/11/COTM_nov2018-Figure5.jpg)
![A rare case of a co-located pigmented naevus and dermal cyst: The utility of very high frequency Ultrasound and Videodermoscopy for differentiation </br> [Nov 2018]](http://s834315022.websitehome.co.uk/wp-content/uploads/2020/11/COTM_nov2018-Figure5a.jpg)
![A rare case of a co-located pigmented naevus and dermal cyst: The utility of very high frequency Ultrasound and Videodermoscopy for differentiation </br> [Nov 2018]](http://s834315022.websitehome.co.uk/wp-content/uploads/2020/11/COTM_nov2018-Figure6.jpg)
![A rare case of a co-located pigmented naevus and dermal cyst: The utility of very high frequency Ultrasound and Videodermoscopy for differentiation </br> [Nov 2018]](http://s834315022.websitehome.co.uk/wp-content/uploads/2020/11/COTM_nov2018-Figure7.jpg)
![A rare case of a co-located pigmented naevus and dermal cyst: The utility of very high frequency Ultrasound and Videodermoscopy for differentiation </br> [Nov 2018]](http://s834315022.websitehome.co.uk/wp-content/uploads/2020/11/COTM_nov2018-Figure8.jpg)
![A rare case of a co-located pigmented naevus and dermal cyst: The utility of very high frequency Ultrasound and Videodermoscopy for differentiation </br> [Nov 2018]](http://s834315022.websitehome.co.uk/wp-content/uploads/2020/11/COTM_nov2018-Figure9.jpg)
1Case Report
Patient L., female, 39-year-old, had been hospitalized in the oncology department, with a melanocytic lesion on the skin of the back between the blades.
The reason for hospitalization was suspicion of a melanoma with lateral growth. At the left side of the melanocytic lesion was an adjacent skin area with slight pigmentation and light hyperemia.
It was important to differentiate the melanoma extent from the benign melanocytic nevus. This was important for prognosis and to aid further diagnostic and treatment steps.
2Examination
There was a melanocytic lesion measuring 12x8 mm, of a dark and light brown color, an oval shape, with clear margins observed on the skin of the back between the blades, at the level of T7/8. To the left side of the melanocytic lesion, in the adjacent skin, was an area hyperpigmentation and mild hyperemia of the skin.
3Videodermoscopy image of the melanocytic lesion (x 50):
The pigmented lesion is symmetrical and the pigmented structure gradually fades to the periphery. The color of the pigment is dark brown in the central part and brown or light brown in the periphery with a regular network pattern. (Fig. 1 and Fig. 2).
In the adjacent skin area on the left side of the pigment lesion, there is a mild increase in skin pattern complexity, mild hyperemia with a weakly pigmented light brown spot measuring 15x12 mm. (Fig. 3, Fig 4.)
For HFU skin imaging we used a pseudo-color scale (Fig. 5.0) in the range of 0-255; where 0 acoustic density – black, 32 – dark green, 64- light green, 128 - blue, 160 - red 255- white etc. In Fig. 5.0, B and A-scans were combined. The A-Scan corresponds to the vertical red line on the B-Scan.
All Scans in Figures 5-8 have a mm bar scale on the side where, every interval black and white bar equals 1mm.
75 MHz ultrasound examination (DUB SkinScanner, tpm taberna pro medicum GmbH, Germany) of the melanocytic lesion (Fig. 5.1) revealed an uneven epidermis thickness of 98-66 microns, a hypoechoic - anechoic subepidermal area 450-50 microns in thickness, and 12 mm in width.
75 MHz ultrasound examination of the adjacent pigmented skin area on the left side of the melanocytic lesion (Fig. 6) showed an even epidermis thickness of 78 microns. A subepidermal hypoechoic band of 50 microns in thickness throughout the scan was also visualized.
33 MHz ultrasound examination of the adjacent pigmented skin area on the left side of the melanocytic lesion (Fig. 7, Fig 8) revealed a hypo-heteroechoic area 8.2 x 4.2 mm, located in the lower part of the dermis and in subcutaneous fat. The upper margin from the skin surface was 1.26 mm, and a lower margin of 5.2 mm.
The lesion has clear borders and the central portion of the lesion was more hyperechoic than the periphery.
18 MHz ultrasound examination in B Mode and Colour and Power Doppler of the adjacent pigmented skin area on the left side of the melanocytic lesion revealed that the hypo-heteroechoic area 8.3x4.0 mm, was located in the lower part of the dermis within subcutaneous fat, and demonstrated posterior acoustic enhancement. The central part of the lesion was hyperechoic and it had a heteroechoic periphery. There was no intra-lesional blood flow.
The clinical diagnosis of a co-located compound naevus and dermal cyst was confirmed by histopathology after surgical excision of both lesions.
4Discussion
In the last decade, High Frequency Ultrasound (HFU) Skin Imaging with centre frequencies of transducers more than 20 MHz has become a reliable instrument in aiding skin lesions diagnosis and measurements [1, 2, 3].
HFU is often used for skin tumour preoperative measurements and postoperative monitoring [4, 5, 6]. The HFU examination is quick and can be easily repeated.
The axial resolution of the HFU at 22-75 MHz is in the range of 72-21 µm respectively. Such resolution produces images very similar to those obtained at histology [7], but the penetration for HFU is limited between 4 and 10 mm, depending on the frequency. Thus, HFU is practically useful for lesions up to 8-10 mm in thickness for 20-30 MHz probes and up to 4 mm for 75 MHz probes.
Early melanoma detection and differentiation with other pigmented lesions is a very important and challenging task for dermatologists and oncologists.
HFU can be used for in vivo melanoma and other melanocytic and non-melanocytic tumour thickness measurements with high accuracy and reproducibility. Guitera P., et al., in a cohort of 52 melanomas and 36 naevi using a 75 MHz probe reported an 87% concordance between ultrasound and histological Breslow thickness, with a high correlation (Pearson's r = 0.908, P < 0.001) [8]. Similarly, Hayashi K., et al., similarly showed good correlation (r = 0.887) in his cohort of 68 melanomas and an even better correlation in the 26 melanomas affecting the soles of the feet, where the sonographic and histologic thickness showed excellent correlation (r = 0.945) [10]. In a larger study by Meyer et al., which compared the usability of the melanoma thickness evaluation using HFU (25 MHz) in 131 patients with pigmented skin lesions, also obtained a good correlation(r=0.87) of results in HFU examination compared with Histology. [11].
Not surprisingly, assessment of the skin melanoma thickness using higher frequency transducers of 100-MHz frequency has better agreement with histology compared to 20-MHz ultrasonography [12]. In addition, a combination of different diagnostic technologies like dermoscopy or videodermoscopy with HFU allows imaging of skin lesion optical patterns with visualization of the internal skin microstructures at near histology resolution [8-12].
Based on the evidence from these studies, a combination of these technique increases the sensitivity and accuracy of distinguishing between malignant and benign skin lesions in their early stages.
In our clinical case, we combined three different frequencies 75 MHz, 33 MHz and 18 MHz in Doppler mode and Videodermoscopy in the normal and polarized light modes. Thus, we had the possibility to see and read the dermoscopic pattern of the naevus and adjacent pigmented skin area, as well as visualize and measure in detail, the internal microstructure of every skin layer – epidermis, dermis and subdermal fat tissue.
The videodermoscopy obtained was typical for a Compound Nevus [Fig. 1,2], but the light pigmentation and redness in the adjacent skin area was suspicious for the lateral growth of the melanoma [Fig. 3,4].
The 75 MHz examination showed clear margins and a superficial lesion with a thickness 450-50 microns and an absence of lateral growth [Fig. 5.1].
The 75 MHz scanning of the pigmented adjacent area showed a decrease in echogenicity in the subepidermal area of 50 μm in thickness, which corresponds to the papillary dermis. The echogenicity decrease was probably associated with the dilatation of microcirculatory blood vessels in the papillary dermis which corresponded to the area of mild hyperaemia on dermoscopy.
The 33 MHz scanning and 18 MHz scanning with CFM Doppler Mode over the pigmented adjacent area showed a hypo-heteroechoic cavity formation with clear boundaries and without any vascularity, with overall features typical for a dermal cyst.
The mild hyperemia and pigmentation of the adjacent skin area could be explained by long time compression between the cyst and underwear (bra clasp).
5Conclusion
This clinical case demonstrates the value of multimodal skin examination – a combination of optical Videodermoscopy, HFU 33&75 MHz and 18 MHz ultrasound in Doppler mode.
The main diagnostic value of this combination is in the accurate preoperative measurement of these lesions and delineation of the margins as well as a differentiation between benign and malignant skin lesions.
This combination suggested (with high probability) the diagnosis of a co-located benign Compound Naevus and Dermal Cyst rather than a melanoma, thus aiding the necessary and appropriate treatment effectively.
6References
- 1. Jasaitiene D., Valiukeviciene S., Linkeviciute G., Raisutis R., Jasiuniene E., Kazys R. Principles of highfrequency ultrasonography for investigation of skin pathology. Eur Acad Dermatol Venereol 2011; 25:375-82.
- 2. Ulrich J., Schwürzer-Voit M., Jenderka K.V., Voit C., Sonographic diagnostics in dermatology. Journal of German Society of Dermatology, 2014, Vol. 12, Issue12:1083-1099.
- 3. Barcaui E., Carvalho F., Lopes F., Piñeiro-Maceira J., Barcaui C., High frequency ultrasound with color Doppler in dermatology. An Bras Dermatol. 2016;91(3):262-73.
- 4. Wortsman X. Common Applications of Dermatological Ultrasonography. J Ultrasound Med 2012;31: 97-111.
- 5. Kleinerman R., Whang T.B., Bard R.L., Marmur E.S. Ultrasound in dermatology: Principles and applications. JAAD, 2012, Vol. 67, Issue 3: 478–487.
- 6. Bezugly A. High frequency ultrasound study of skin tumors in dermatological and aesthetic practice. Med Ultrason 2015, Vol. 17, no. 4: 41-544.
- 7. Foster F.S., Pavlin C.J., Harasiewicz K.A., Christopher D.A., Turnbull D.H., Advances in ultrasound biomicroscopy. Ultrasound in Med. & Biol., 2000, Vol. 26, No. 1: 1-27.
- 8. Guitera P., Li L.X., Crotty K., FitzGerald P., Mellenbergh R., Pellacani G., Menzies S.W. Melanoma histological Breslow thickness predicted by 75-MHz ultrasonography. British Journal of Dermatology, 2008, 159: 364–369.
- 9.Kardynal A., Olszewska M., Modern non-invasive diagnostic techniques in the detection of early cutaneous melanoma. J Dermatol Case Rep 2014, 1: 1-8.
- 10. Hayashi K., Koga H., Uhara H., Saida T. High-frequency 30-MHz sonography in preoperative assessment of tumor thickness of primary melanoma: usefulness in determination of surgical margin and indication for sentinel lymph node biopsy. Int J Clin Oncol 2009;14:426-30.
- 11. MeyerN., Lauwers‐Cances V., Lourari S., Laurent J., Konstantinou M.P., Lagarde J.M., Krief B., Batatia H., Lamant L., Paul C. High‐frequency ultrasonography but not 930‐nm optical coherence tomography reliably evaluates melanoma thickness in vivo: a prospective validation study. British Journal of Dermatology 2014, Vol. 171, 4: 799-805.
- 12. Gambichler T., Moussa G., Bahrenberg K., Vogt M., Ermert H., Weyhe D., et al. Preoperative ultrasonic assessment of thin melanocytic skin lesions using a 100-MHz ultrasound transducer: a comparative study. Dermatol Surg 2007, 33:818-24.
7Figure Legends
Figure 1.
The videodermoscopy image x 50 of the melanocytic skin lesion in the normal light. The pigmented lesion is symmetrical, the pigmented structure gradually fades to the periphery, the color of the pigment is a mixture dark brown, brown and light brown, which are characteristic for a nonmalignant pigmented nevus.
Figure 2. The videodermoscopy image x 50 of the melanocytic skin lesion in polarized light. The pigment distribution has a normal network structure.
Figure 3. The videodermoscopy image x 50 of the adjacent pigmented skin area in normal light. The skin pattern is increased and the skin in the region of interest (ROI) is slightly pigmented, with a light brown colour.
Figure 4. The videodermoscopy image x 50 of the adjacent pigmented skin area in polarized light. The skin in the ROI slightly pigmented with a light brown colour, also mild hyperemia is also visualized in the ROI. The spot size is 15x12 mm.
Figure 5.0. The combination of the B75 MHz B-Scan (left side) and A-Scan (right side). The A scan corresponds to the vertical red line on the B-Scan. The pseudo-colour scale 0-255 is at the top of the image.
Figure 5a. 75 MHz scan of the pigmented nevus. e-epidermis, d-dermis, h- hair, hf- hair follicle, nevus (red arrows). Epidermis has uneven thickness 98-66 μm, nevus has hypo-heteroechoic structure. The naevus thickness is 50-450μm and a width of 12 mm.
Figure 6. 75 MHz scan of the adjacent to the nevus pigmented skin area. e-epidermis, d-dermis, h- hair, hf- hair follicle, pd - papillary dermis (red arrows) The epidermis thickness is even measuring 78 μm. The subepidermal, hypoechoic narrow band of 50μm is visualized throughout the image.
Figure 7. 33 MHz image of the adjacent to the nevus pigmented skin area. f-foil on the tip of the probe, e-epidermis, d-dermis, fat- fat tissue, cyst – dermal cystic lesion margins (red dotted line), fas – fascia. The hypo-heteroechoic area 8.2x4.2 mm is shown located in the lower part of the dermis and within subcutaneous fat. The upper margin from the skin surface 1.26 mm, lower margin 5.2 mm. The lesion has clear borders and a central hyperechoic region.
Figure 8. Same as Fig 7, 33 MHz image of the adjacent to pigmented naevus skin area with Hilbert transformation. The margins of the cyst is better visualized. f-foil on the tip of the probe, e-epidermis, d-dermis, fat- fat tissue, cyst – dermal cystic lesion, fas – fascia.
Figure 9. 18 MHz image in B-Mode and Colour and Power Doppler Mode of the adjacent to the nevus pigmented skin area. The hypo-heteroechoic area 8.2 x 4.2 mm is located in the lower part of the dermis and in subcutaneous fat, with posterior acoustic enhancement. The central part of the lesion is hyperechoic with heteroechoic periphery. There was no intra-lesional blood flow.