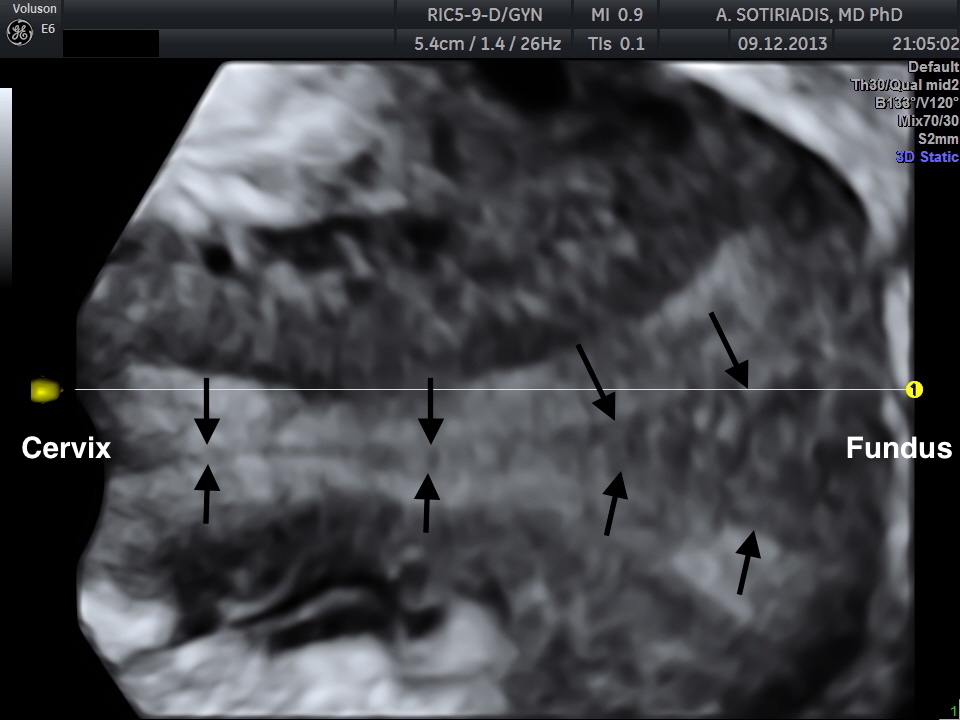
One-stop differential diagnosis of Mllerian anomalies using 3D ultrasound: complete uterine septum [Nov 2016]
November 11, 2016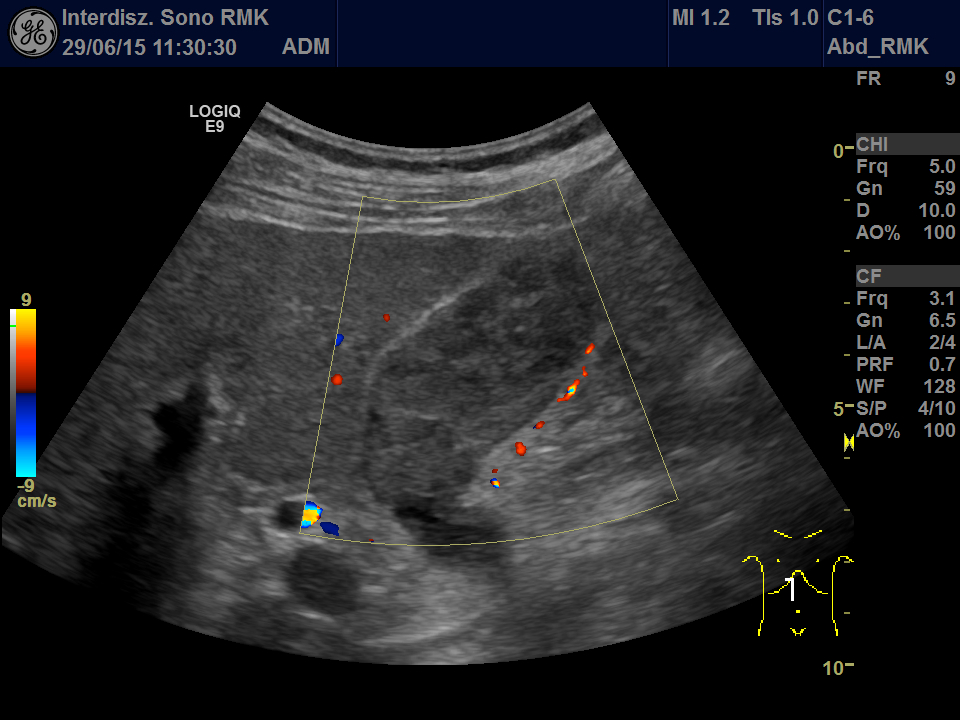
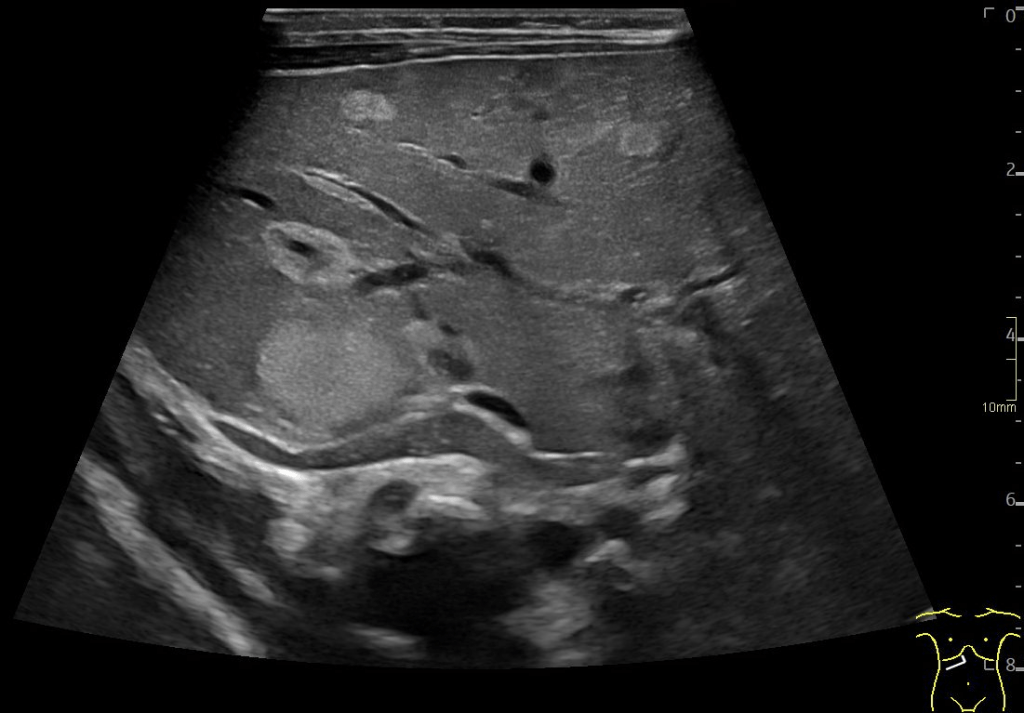
A rare tumor in the gallbladder mimicking sludge [Jan 2017]
January 11, 2017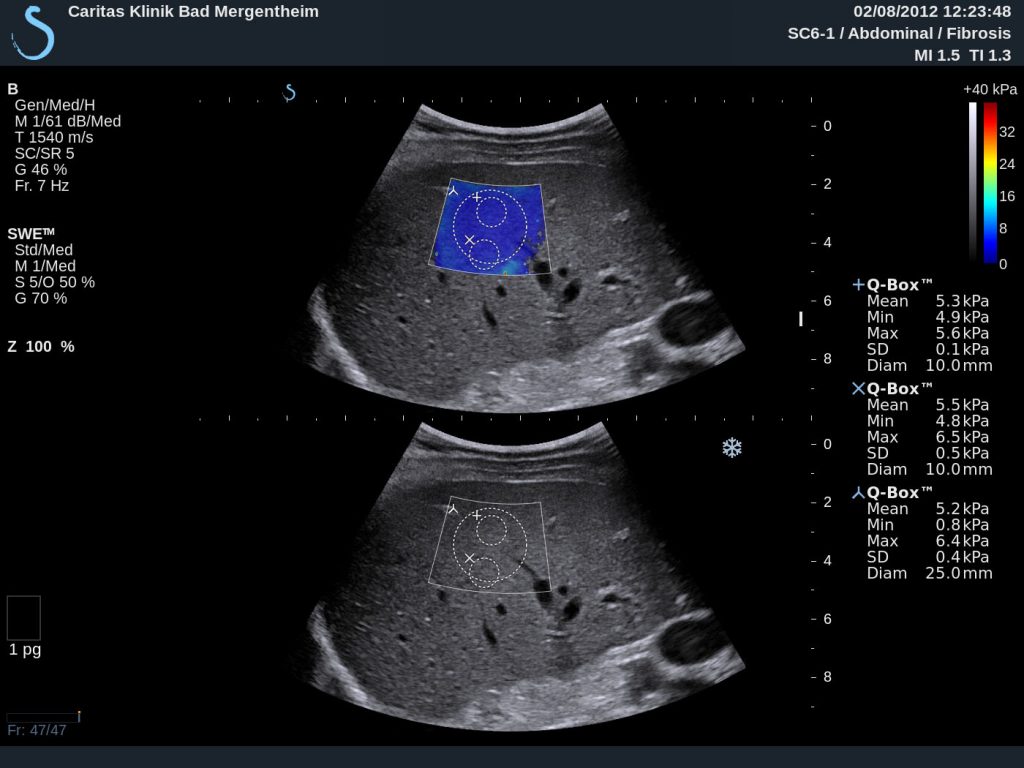
Supersonic Shear Imaging ShearWave Elastography
Medizinische Klinik 2, Caritas-Krankenhaus
Uhlandstr. 7. 97980 Bad Mergentheim
Tel:+49 7931 58 2201. Email: christoph.dietrich@ckbm.de
![Supersonic Shear Imaging ShearWave Elastography</br> [Dec 2016]](http://s834315022.websitehome.co.uk/wp-content/uploads/2020/11/cotm_dec2016-fig1a.jpg)
![Supersonic Shear Imaging ShearWave Elastography</br> [Dec 2016]](http://s834315022.websitehome.co.uk/wp-content/uploads/2020/11/cotm_dec2016-fig1b.jpg)
![Supersonic Shear Imaging ShearWave Elastography</br> [Dec 2016]](http://s834315022.websitehome.co.uk/wp-content/uploads/2020/11/cotm_dec2016-fig1c.jpg)
![Supersonic Shear Imaging ShearWave Elastography</br> [Dec 2016]](http://s834315022.websitehome.co.uk/wp-content/uploads/2020/11/cotm_dec2016-fig2.jpg)
![Supersonic Shear Imaging ShearWave Elastography</br> [Dec 2016]](http://s834315022.websitehome.co.uk/wp-content/uploads/2020/11/cotm_dec2016-fig3.jpg)
1 Case report We report on shear wave elastography using Supersonic Imaging (SSI) from a practical point. The procedure was repeated three times of three different scanning views in order to acquire three valid independent SWE™ maps. Examples are shown in Figure 1. The case reports in healthy subjects, patients with intermediate fibrosis and liver cirrhosis were summarized and analyzed to discuss basic principles, imaging acquisition, data reproducibility, advantages and limitations of this method as part of the Shear Wave Elastography Research Group activities (SWERG).
ShearWave™ Elastography (SWE™) is an ultrasound elastography modality that is based on supersonic shear imaging (SSI), first reported by Bercoff et al. [1]. Its implementation in clinical routine requires an UltraFast™ Imaging ultrasound platform, which was developed by SuperSonic Imagine (Aixplorer®, Aix-en-Provence, France). Its first application to map viscoelastic properties of the liver was reported in 2009 by Muller et al. [2]. The SSI technique provides tissue elasticity imaging from the estimation of the velocity of shear waves, generated by an acoustic radiation force (ARF) [1,3,4]. This remote ARF or “pushing beam” is generated by conventional ultrasound equipment that focuses ultrasound signals in tissue. It results in the displacement of tissue in the range of a few microns, which propagates as a transient shear wave in tissue. By successively moving the focus of the ARF at increasing depths, at a speed that is higher than the speed of the shear wave itself, “supersonic” constructive interferences of the elementary shear waves take place, thus producing a quasi-plane shear wave front. Then, the ultrasound equipment switches to an UltraFast™ Imaging sequence that acquires ultrasound data at a frame rate in the range of 3 000 to 20 000 frames/second [Figure 2]. To build up each ultrafast ultrasound 2D image, a single ultrasound plane wave is transmitted, and beam formation is performed in post-processing.
A cross-correlation algorithm is then applied to consecutive ultrafast ultrasound 2D images in order to determine the axial displacement field that is created by the propagation of the shear wave front inside tissue. The result is a set of images giving the displacement induced by the shear wave at each sampling time [Figure 3].
It is then possible to use the shear wave propagation movie to compute the shear wave speed (SWS) map or medium elasticity map, making the assumption that tissue is infinite, isotropic, purely elastic and locally homogeneous.
Two simple rules require attention and need to be followed in order to ensure adequate SWE™ acquisitions and measurements:
3.1.1 Optimization of the acoustic window
The generation of the shear waves and the recording of their propagation is based on ultrasound physics in biological tissue. Therefore, the best acoustic window should be obtained and ensured on grayscale imaging prior to entering into SWE™ imaging mode. This should be achieved by using the appropriate the patient’s positioning: lying supine, with the right arm in maximum abduction. The left lateral decubitus position should be used only if necessary. Extra pressure should be applied on the probe and on the patient while scanning intercostally, in order to enlarge the intercostal space. This will eliminate acoustic shadowing from the ribs and maximize acoustic transmission by increasing the contact surface between the probe and the patient’s skin.
3.1.2 Avoiding any movements
The probe should stay still; the acoustic window should not change once it is selected for measurement to allow the elastogram to stabilize for a few seconds (at least 3 seconds). In addition, liver motion should be avoided as well by asking the patient to suspend breathing while the elastogram is stabilizing.
3.2 SWE™ scanning general protocol
3.2.1 Patient’s positioning and conditions
Fasting is mandatory and normal breathing is recommended during normal scanning. Apply a sufficient layer of gel directly on the selected place and on the probe. The patient should be placed in the supine position with the right arm in maximum abduction so as to enlarge the intercostal space, and maximize the contact surface between the ultrasound probe and the skin.
3.2.2 Ultrasound probe and access
Select the "Liver" preset in the "Abdominal" application on the SC6-1 or the XC6-1 curved probes. Scan intercostally, holding the probe within the intercostal space and as perpendicular as possible to the liver capsule. Only if required, the patient could be scanned subcostally, although it is not recommended.
3.2.3 Grayscale image
Find the best acoustic window while scanning in B-Mode. If needed, enlarge the intercostal space, and decrease the thickness of the subcutaneous fat layer by using correct patient positioning and by applying enough pressure on the probe. Ensure an optimal ultrasound transmission, by maximizing the contact surface between the probe and the skin. Place the probe parallel to the intercostal window to avoid shadowing from the ribs. Once the best acoustic window is found, and an area of liver parenchyma free of major vessels or other anatomical structures can be found, avoid any movement of the probe and turn on SWE imaging.
3.2.4 SWE™ image
If scanning is performed intercostally, contrary to the rule for soft tissue, an extra pressure must be applied on the probe. The pressure will be absorbed by the ribs without impact on liver elasticity, while ensuring proper ultrasound signal transmission. If scanning is performed subcostally, apply the slightest pressure required for a proper visualization in B-Mode. Use the SWE™ default settings first since they have been optimized for the assessment of liver fibrosis. Adjust them only if it is necessary. For example, after stabilization of the elastogram, if a lack of SWE signal remains, even with increased pressure on the probe and adequate suspended breath, turn the SWE Option control to "Penetration".
3.2.5 Position of the SWE™ Box
Move the SWE Box over an area of liver parenchyma that is free of major vessels or other anatomical structures, as seen on the B-Mode image. Locate the SWE Box at least at 2 cm in depth from the liver capsule, and between 3 - 5 cm from the probe surface. Before freezing the image, the patient should suspend his/her breath for at least 3-4 seconds during the expiration phase. This delay allows for a sufficient stabilization and filling of the SWE Box, provided a lack of any movement is ensured. The global validity of a SWE™ map can be assessed by its stability over time (3 to 5 seconds) and its smooth (un-pixelated) appearance.
3.2.6 SWE™ stiffness quantification
Once the SWE™ map is satisfactory, freeze and select the Q-Box™ measurement tool. Resize its diameter to 15-20 mm if needed, place it preferably at the center of the SWE Box, over an area of relative homogeneous elasticity, at a depth of 3-5 cm; do not place it over an area with missing SWE™ pixels. On recent software versions of Aixplorer® liver package, a Stability Index has been added as an indicator of SWE map homogeneity and temporal stability. This index is displayed while positioning the built-in Q-Box™ quantification tool. A Stability Index below 90% should lead to the rejection of the Q Box™ location, and push the operator to find a better location. In the event no satisfactory location can be found on a given frozen SWE™ map, a new SWE™ acquisition should be performed.
- A few (around 4) elementary ARF pushes are required along the same axial line.
- The amount of acoustic energy sent in tissue remains within the NEMA/FDA limits
- no heating of the probe, no cool-down phase
- The depth of each initial ARF pushes can be adapted to different anatomy and thickness of target tissue.
- The supersonic effect increases the efficiency of shear wave generation by a factor of 4 to 8 as compared to a non supersonic ARF source.
- produces shear wave fronts that can propagate over several centimeters within biological tissue
- linear shear wave fronts provide comfortable SNR. Reliability of data collected is increased.
- Only a few (3 to 4) supersonic sequences are required to cover the whole field of view
- The size of the area of interest can be fully adjusted by the user and can be enlarged if needed.
UltraFast™ Imaging:
- Captures all ultrasound information over the whole field of view at once
- guarantees a display frame rate that is not impacted by the size of the area of interest
- no compromise is required between SWE display frame rate, SWE Box size, SWE Box depth, maximum stiffness targeted
- Enables local estimation of SWS and tissue elasticity at each pixel, with a millimetric spatial resolution.
- Enables real-time mapping up to several SWE frames per second
- provides real-time live visual feedback to the operator so the scanning technique can be adapted
- provides relevant information to choose the optimal acoustic window, scanning plane and avoid artifacts
- can be fully integrated into the routine imaging workflow
The combination of the supersonic push together with the ultrafast plane wave ultrasound acquisition enables to reach SWE™ maps display frame rates in the range of 2 to 5 SWE™ maps per seconds. The real-time scanning conditions are made possible thanks to the lack of any cool-down phase, and provide a real-time feedback to the operator, thus allowing real-time adjustment of the scanning technique. In addition, thanks to the ultrafast plane wave acquisition, no compromise is required between the SWE™ map spatial and temporal resolutions on the one hand, and its size, depth or maximum values displayed on the other hand. The UltraFast™ Imaging technique utilizes a high frame rate to enable a high quality simultaneous grayscale image.
Aixplorer® and SWE™ operators should undergo a training phase of about 20-30 patients in order to reach a level of technical failures of less than 10%, ideally in the range of 5-6%. This rate seems to be a good indicator of the level of practice training. An emphasis needs to be put on the mandatory extra-pressure that is required with SSI SWE, which may not apply to other shear wave-based elastography techniques.
5.4 How to improve a difficult SWE acquisition
1- Ensure the patient’s positioning is compliant with the protocol above: there are 3 main causes of patient’s wrong positioning.
- a. Left lateral decubitus instead of dorsal decubitus
- b. Right arm in maximum abduction in order to enlarge the intercostal space
- c. It is possible to ask the patient to bend his/her thorax to increase spacing between the ribs
2- The operator should pay attention to the stability of the image:
- a. Some patients manage to suspend their breath, but still have difficulties to avoid movements of their liver from abdominal muscular contractions. In such cases, it may be useful for them to watch the monitor and recognize liver motion on the live image. A quick patient’s training can be recommended.
- b. Do not rush the exam: once an excellent acoustic window is found in grayscale imaging, turn on SWE™, while trying to keep the excellent acoustic window. Once SWE™ is turned on, hold the probe still and do not change the examination window.
3- Lack of pressure on the probe, i.e. lack of optimal ultrasound transmission.
- a. In challenging patients, the operator may need to press with both hands on the probe, for at least 3-4 seconds. The SWE™ cine loop can then be browsed after freezing the image to find the best SWE™ acquisition.
- b. Acquisition should be tested in different intercostal spaces. Some may offer a much better acoustic window than others. Attention should be made on the global quality and sharpness of the grayscale image prior to entering into the SWE™ mode.
5.5 Generalization issues
It seems that liver stiffness measurements performed with one type of equipment cannot be translated to other equipment from other manufacturers, since all are using different sequences and different techniques to provide a stiffness measurement. In terms of diagnostic performances, it seems all equipment provide more or less the same capabilities to differentiate consecutive fibrosis stages. However, performances seem to be weaker when measurements are performed in m/s instead of kPa, due to the lower contrast in values measured at different fibrosis stages. Equipment that provides an anatomical imaging guidance is expected to be more clinically usable. Equipment that provides stiffness imaging guidance is expected to be even more applicable and reliable because it allows avoiding artifacts or unexplained changes in tissue stiffness. The latter can also be used to assess stiffness heterogeneity, which could appear in the future to be meaningful clinical information.
- Bercoff J, Tanter M, Fink M. Supersonic shear imaging: A new technique for soft tissues elasticity mapping. IEEE Trans Ultrason Ferroelectr Freq Control. 2004 Apr;51(4):396-409.
- Muller M, Gennisson JL, Deffieux T, Tanter M, Fink M. Quantitative viscoelasticity mapping of human liver using supersonic shear imaging: preliminary in vivo feasibility study. Ultrasound Med Biol. 2009 Feb;35(2):219-29.
- Bercoff J, Tanter M, Muller M, Fink M. The role of viscosity in the impulse diffraction field of elastic waves induced by the acoustic radiation force. IEEE Trans Ultrason Ferroelectr Freq Control 2004;51:1523–1536.
- Bercoff J, Tanter M, Fink M. Sonic boom in soft materials: The elastic Cerenkov effect. Appl Phys Lett 2004;84(12):2202–2204.
Figure 2:Acquisition ultrasound sequence used to perform supersonic shear imaging in tissue, here using an ultrafast ultrasound imaging acquisition rate of 3 000 Hz.
Figure 3: Successive ultrasound images showing the propagation of the shear wave in a phantom, as recorded by the ultrafast ultrasound imaging sequence and the dedicated cross-correlation algorithm.